Investing
Published by Gbaf News
Posted on February 28, 2014

Global Banking and Finance Review is an online platform offering news, analysis, and opinion on the latest trends, developments, and innovations in the banking and finance industry worldwide. The platform covers a diverse range of topics, including banking, insurance, investment, wealth management, fintech, and regulatory issues. The website publishes news, press releases, opinion and advertorials on various financial organizations, products and services which are commissioned from various Companies, Organizations, PR agencies, Bloggers etc. These commissioned articles are commercial in nature. This is not to be considered as financial advice and should be considered only for information purposes. It does not reflect the views or opinion of our website and is not to be considered an endorsement or a recommendation. We cannot guarantee the accuracy or applicability of any information provided with respect to your individual or personal circumstances. Please seek Professional advice from a qualified professional before making any financial decisions. We link to various third-party websites, affiliate sales networks, and to our advertising partners websites. When you view or click on certain links available on our articles, our partners may compensate us for displaying the content to you or make a purchase or fill a form. This will not incur any additional charges to you. To make things simpler for you to identity or distinguish advertised or sponsored articles or links, you may consider all articles or links hosted on our site as a commercial article placement. We will not be responsible for any loss you may suffer as a result of any omission or inaccuracy on the website.
Published by Gbaf News
Posted on February 28, 2014
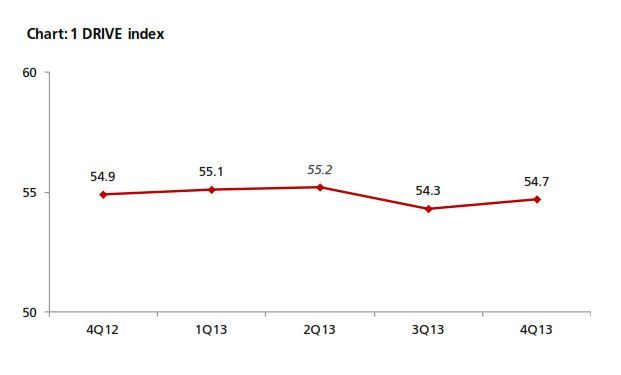
The 4Q13 reading rose – What happened to the index components?
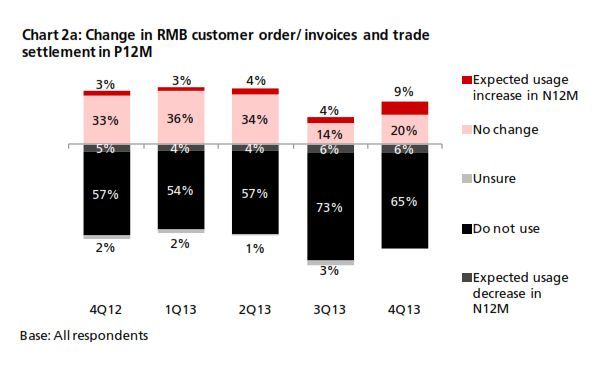
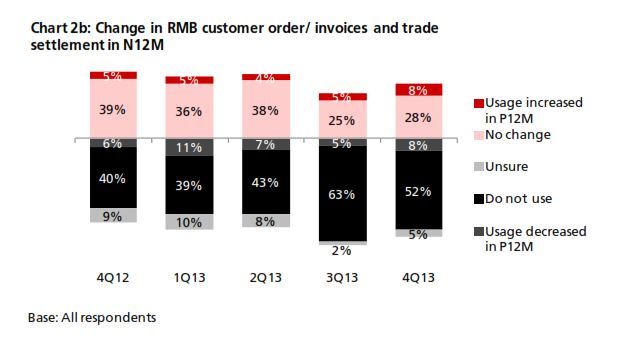
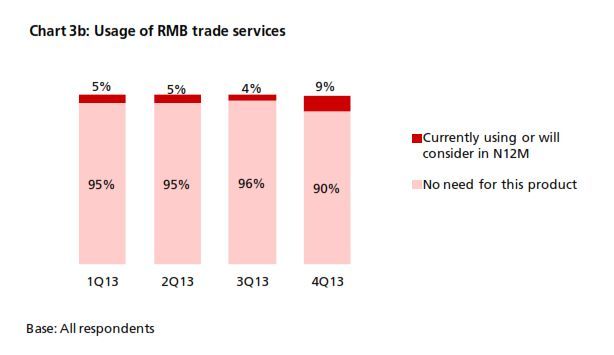
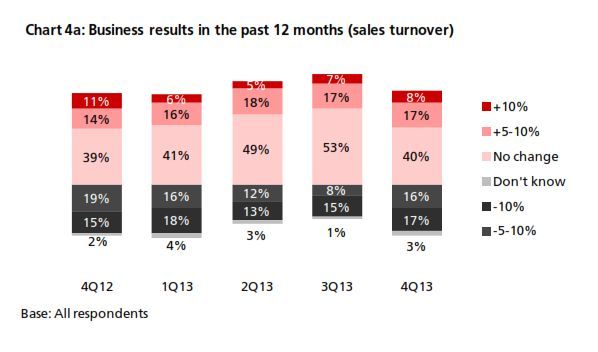
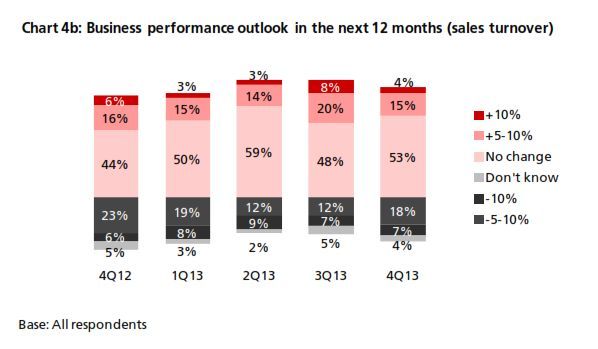
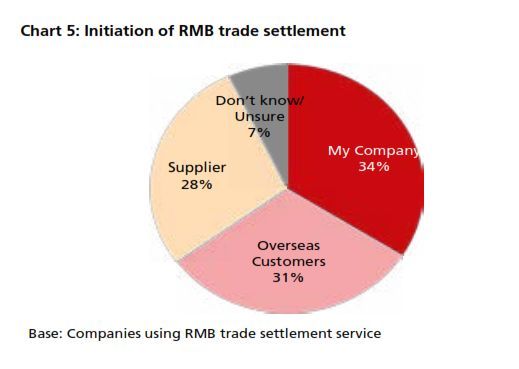
The 4Q13 reading of DRIVE rebounded to 54.7 from 54.3 in 3Q13 (Chart 1). The increase came amid increasing business needs for RMB. In 4Q13, there was a rebound in RMB customer orders and trade settlement, although the proportion of companies using these was below that from a year earlier (Chart 2). In terms of RMB services and products, more companies reported that they are currently using or will consider using RMB payment/receivables and RMB trade services (Chart 3a & 3b) than in all the previous quarters. Interestingly, the general improvement in the usage of RMB services and products in 4Q13 came despite findings showing slightly poorer business performance in the previous 12 months and a more pessimistic business performance outlook for the next 12 months (Charts 4a & 4b). This means that the speed and depth of RMB development in Hong Kong hinges on factors other than local economic and business performance. As Hong Kong is an open economy, its offshore RMB development should be evaluated in the broader context of international RMB development. To put this into perspective, the 4Q13 survey revealed that the initiation of RMB trade settlement is equally split among the Hong Kong companies surveyed (34%), their overseas customers (31%) and their suppliers (28%) (Chart 5). This means that the preferences of overseas players also con- tribute to the RMB development of Hong Kong. Arguably, the preferences of these external parties are shaped in part by their country’s own pace of RMB development. As such, future surveys will continue to monitor Hong Kong’s corporate usage of RMB with a global view in mind.
Finally, regarding access to RMB finance, the perception about the ease of access remained fairly constant in 4Q13 compared to previous quarters.
Key findings and DBS insights
* Unless stated otherwise, figures in parentheses represent findings in the previous survey (3Q13)
1. Business needs for RMB have rebounded
DBS insights
Business needs for RMB is a key indicator of actual RMB acceptance and usage levels at the corporate level. After tracking this component for five quarters, there is no evidence of an uptrend in RMB corporate penetration. In particular, the higher reading in 4Q13 compared to that of 3Q13 should be not be seen as an improvement, as it is merely a recovery from the relatively weak results of 3Q13.
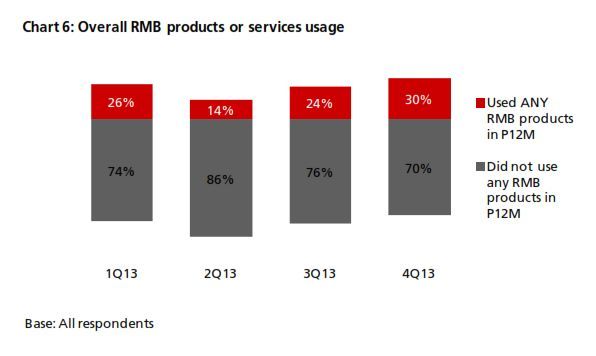
2. Usage of RMB services and products achieved record highs
DBS insights
The percentage of companies using RMB services and products in 4Q13 was the highest recorded to date. While it is still too early to say that this is the start of an uptrend, the 30% usage rate is quite significant in terms of offshore centre development.
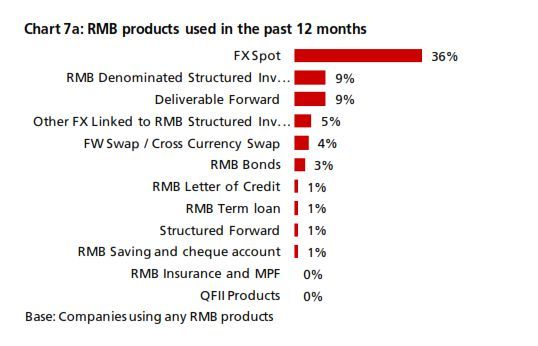
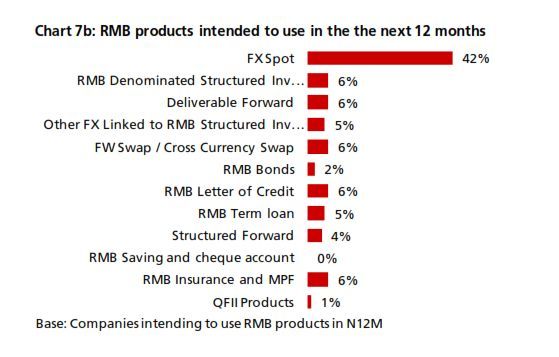
3. Expansion of RMB corporate product scope
DBS insights
The past five quarters of findings showed no consistent trends in the usage of most RMB products. The usage of products such as structured investment deposits (SIDs) and deliverable forwards fluctuated from quarter to quarter.
While efforts to develop RMB products and related financial infrastructure can arouse corporate interest, a sustained take-up of RMB products ultimately de- pends on their business needs for RMB, which showed signs of increasing.
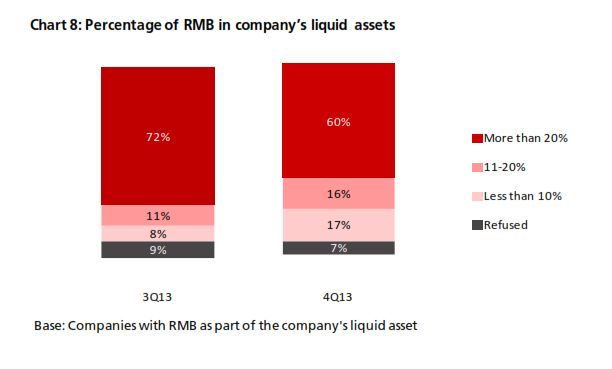
4. Usage options for RMB liquid assets are limited
DBS insights
These findings reflect that companies either did not take advantage of short- term cash management solutions or did not require such solutions. This may also indicate a lack of short-term liquid RMB investment products in the market. As RMB takes up more and more of corporate liquid assets, both financial institutions and companies could begin to explore RMB liquidity management solutions or short-term investments.
Other findings
The outlook: favourable policy support remains the key driver behind corporate usage of RMB
Key Charts & Graphs